Q2 2025 Canada Freight Market Update
Arrive Logistics is committed to giving you the data and insights you need with the Q2 2025 Canada Freight Market Update
This report has been prepared by Arrive Logistics, a CITT-Endorsed Business Partner, and shared with their permission. CITT occasionally shares reports, whitepapers, and other content from our partners, allies, and membership for the information of our readers.
Introduction
The Canadian freight market deviated sharply from typical patterns in the first half of 2025, driven by tariff-related uncertainty in both Canada and the U.S. The timing and structure of the tariff rollouts created short bursts of urgent demand to move goods across the border, leading to equipment imbalances and cross-border capacity disruption.
Conditions stabilized in the second quarter as the trade environment became more clearly defined. The many shipments that were pulled forward to avoid tariff impacts are a key reason behind today’s depressed cross-border volumes. At the same time, rising inflation and reduced manufacturing output in Canada are slowing freight activity across both cross-border and domestic lanes.
Trade policy remains a risk, as do ongoing FMCSA rules around foreign drivers and English language requirements. Still, capacity has grown more stable and reliable, and we expect minimal disruption beyond typical seasonality moving forward.
Truckload Outlook
The trade war with the U.S. will continue to weigh on freight volumes across both cross-border and intra-Canadian lanes for the foreseeable future. After brief surges in shipping activity earlier this year, data from May began to illustrate the potential longer-term impacts ahead.
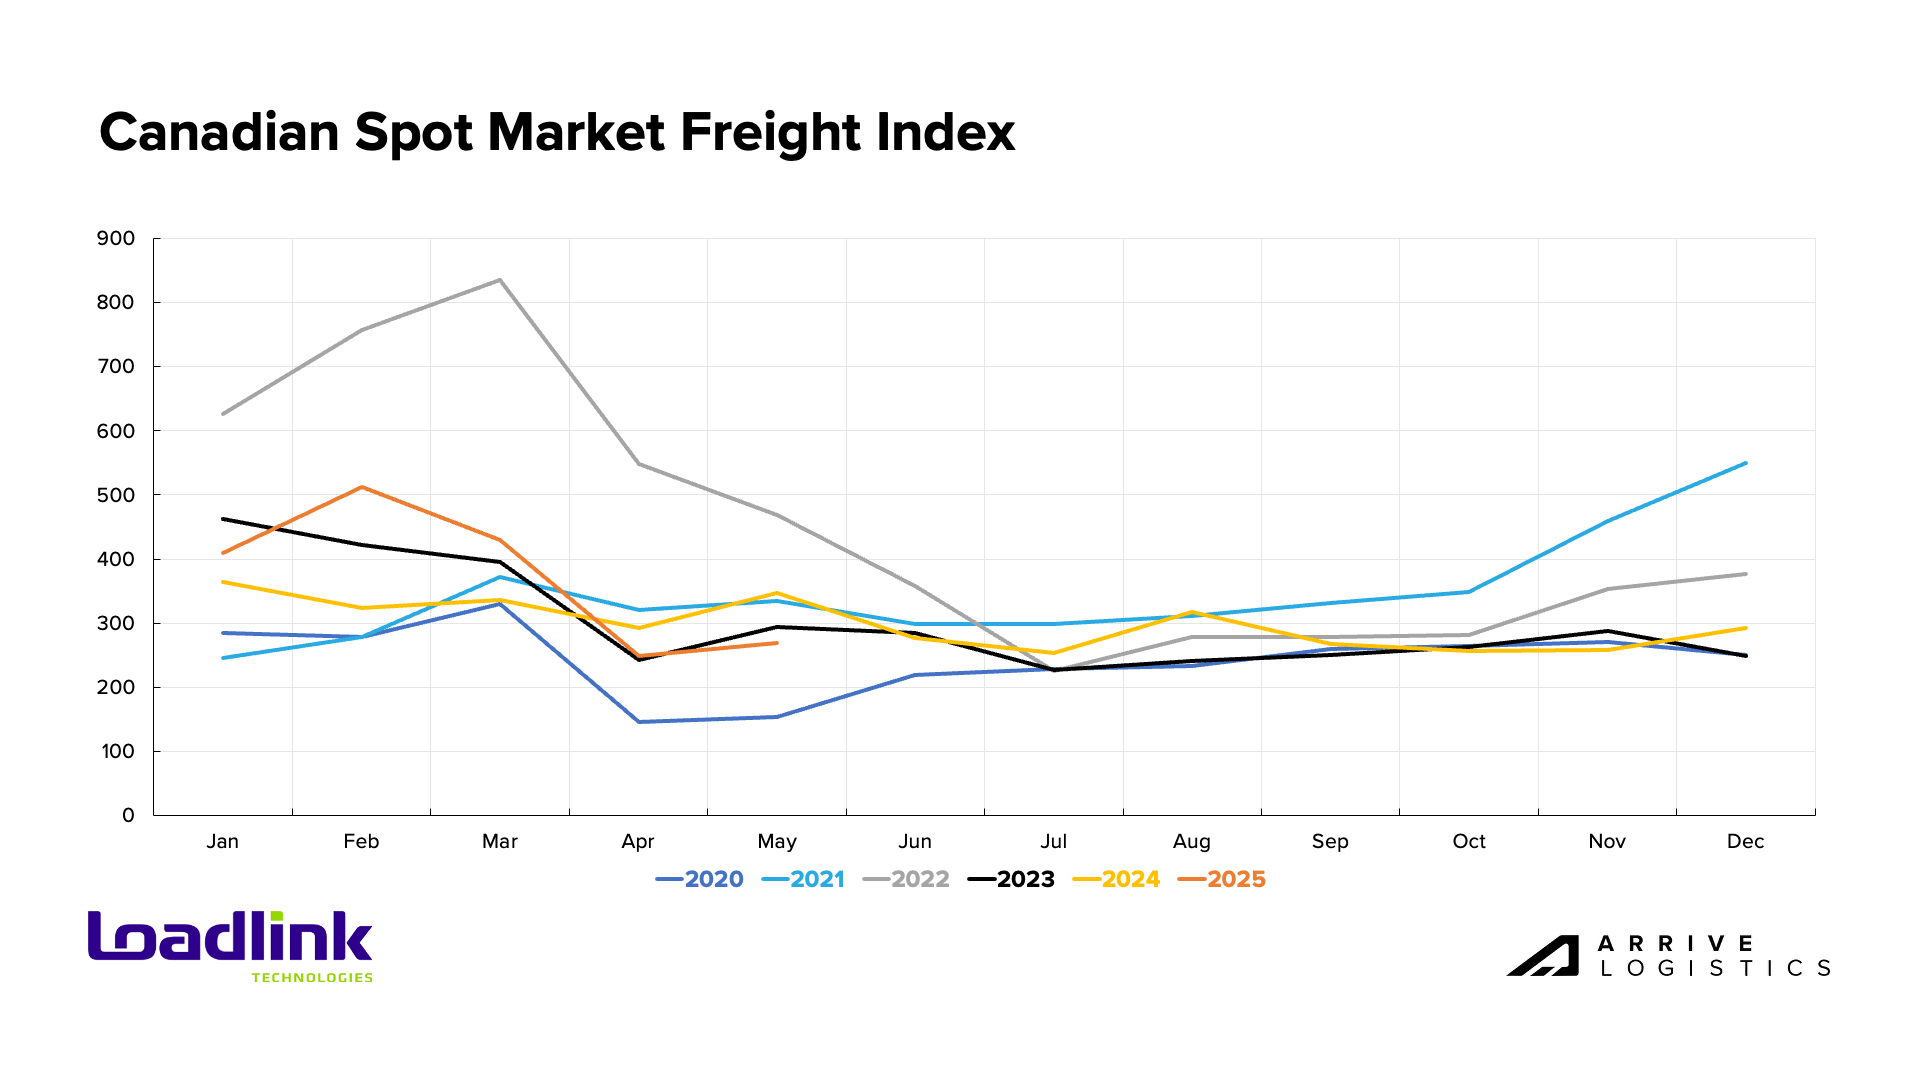
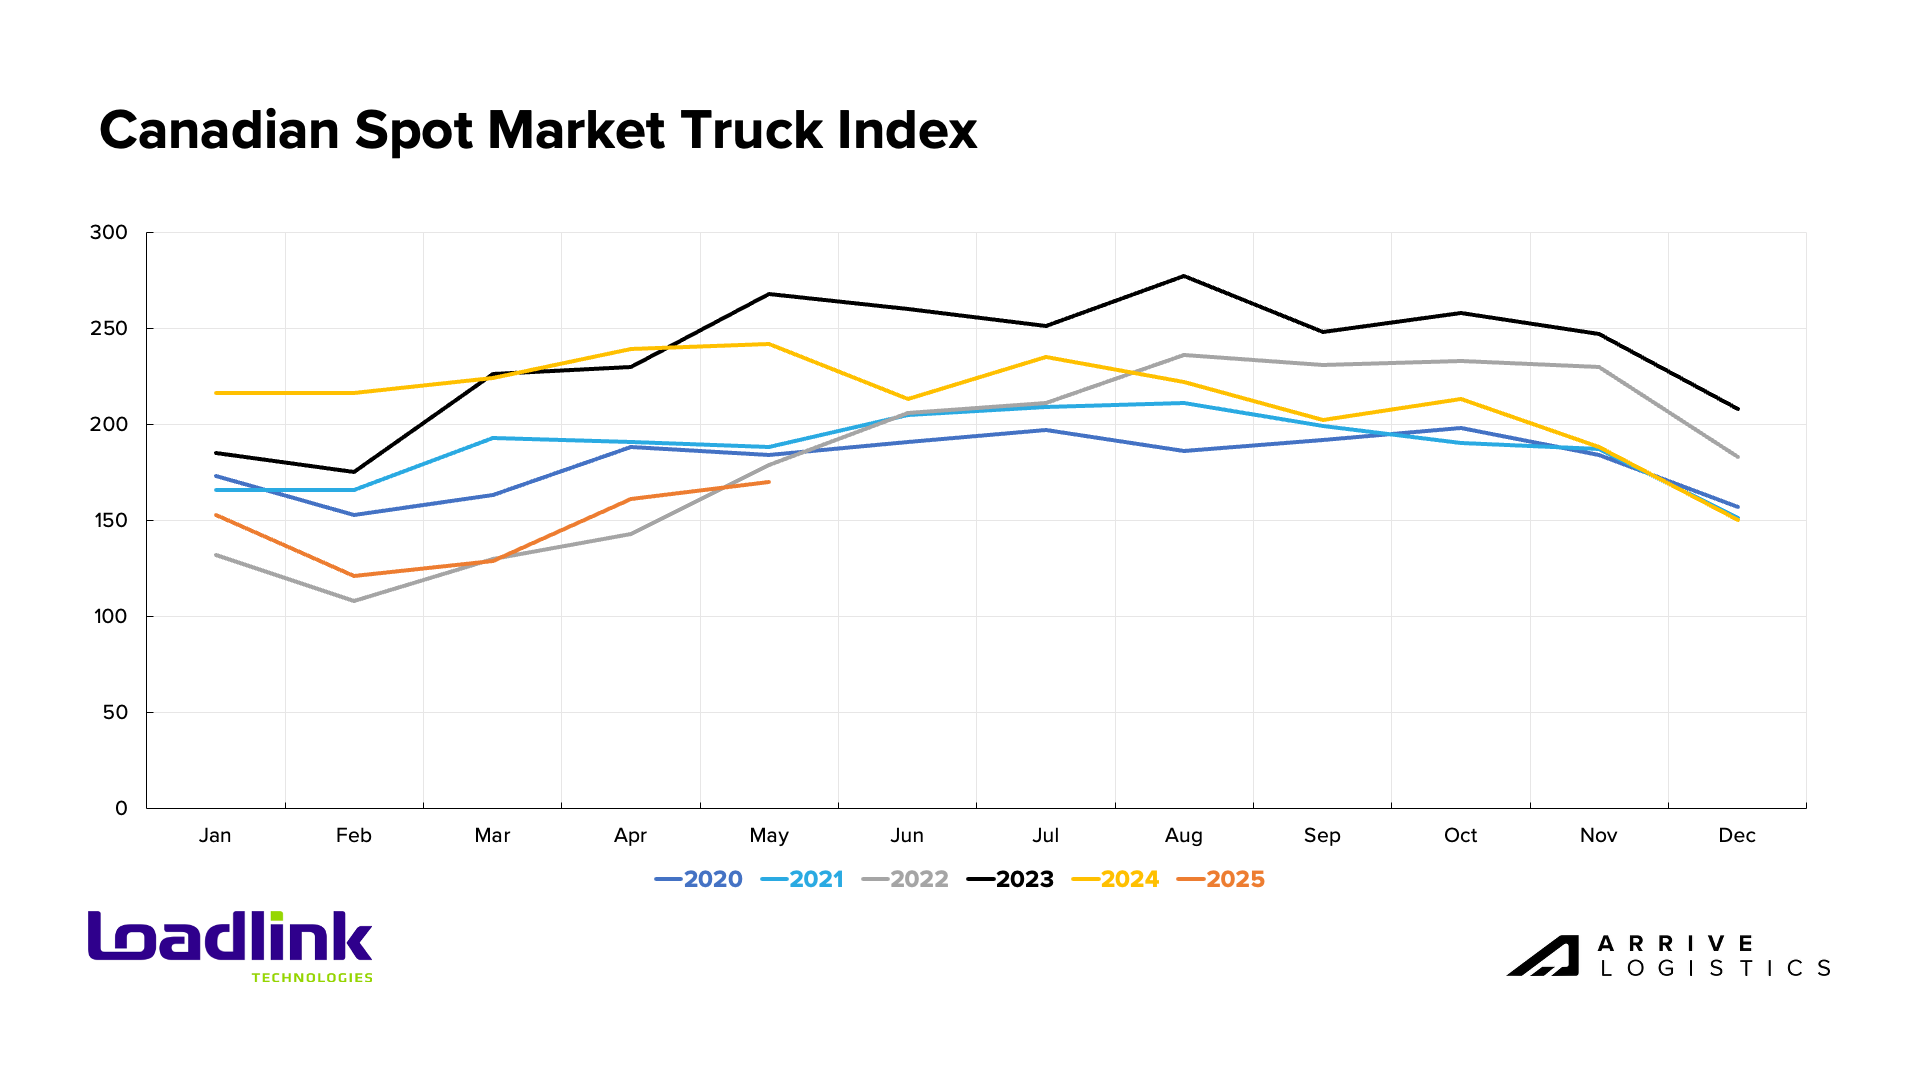
LoadLink’s Canadian Spot Market Freight Index rose significantly year over year in Q1, with load postings up 58% in February and 40% in March. That trend reversed in Q2, with volumes down 15% in April and 22% in May compared to the same months in 2024. Because LoadLink primarily tracks spot market activity, it offers a clear view into the volatility that marked the start of the year, and the relative stabilization that has followed.
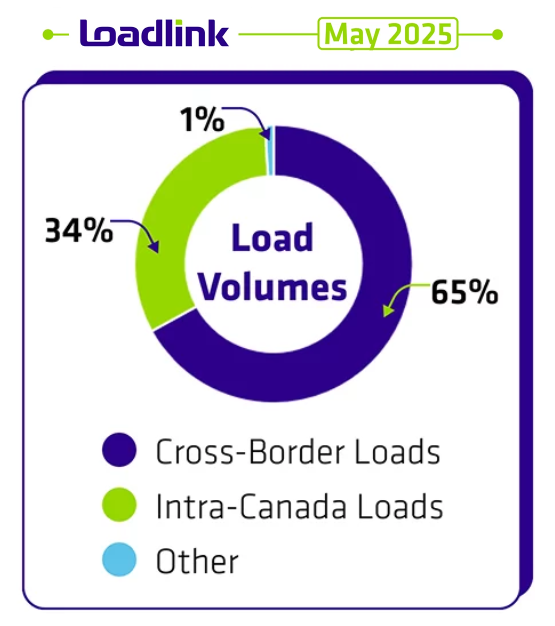
LoadLink data also highlighted several key spot market activity trends. Despite the tariff environment, cross-border freight made up 65% of all load postings, with inbound shipments to Canada showing more strength than outbound freight to the U.S. Inbound volumes rose 28% from April, while outbound loads fell 17%. Intra-Canada freight was more stable, dipping just 2% month-over-month. Still, all three lanes were down at least 20% year over year in May, underscoring the trade war’s broad impact on Canadian freight flows.
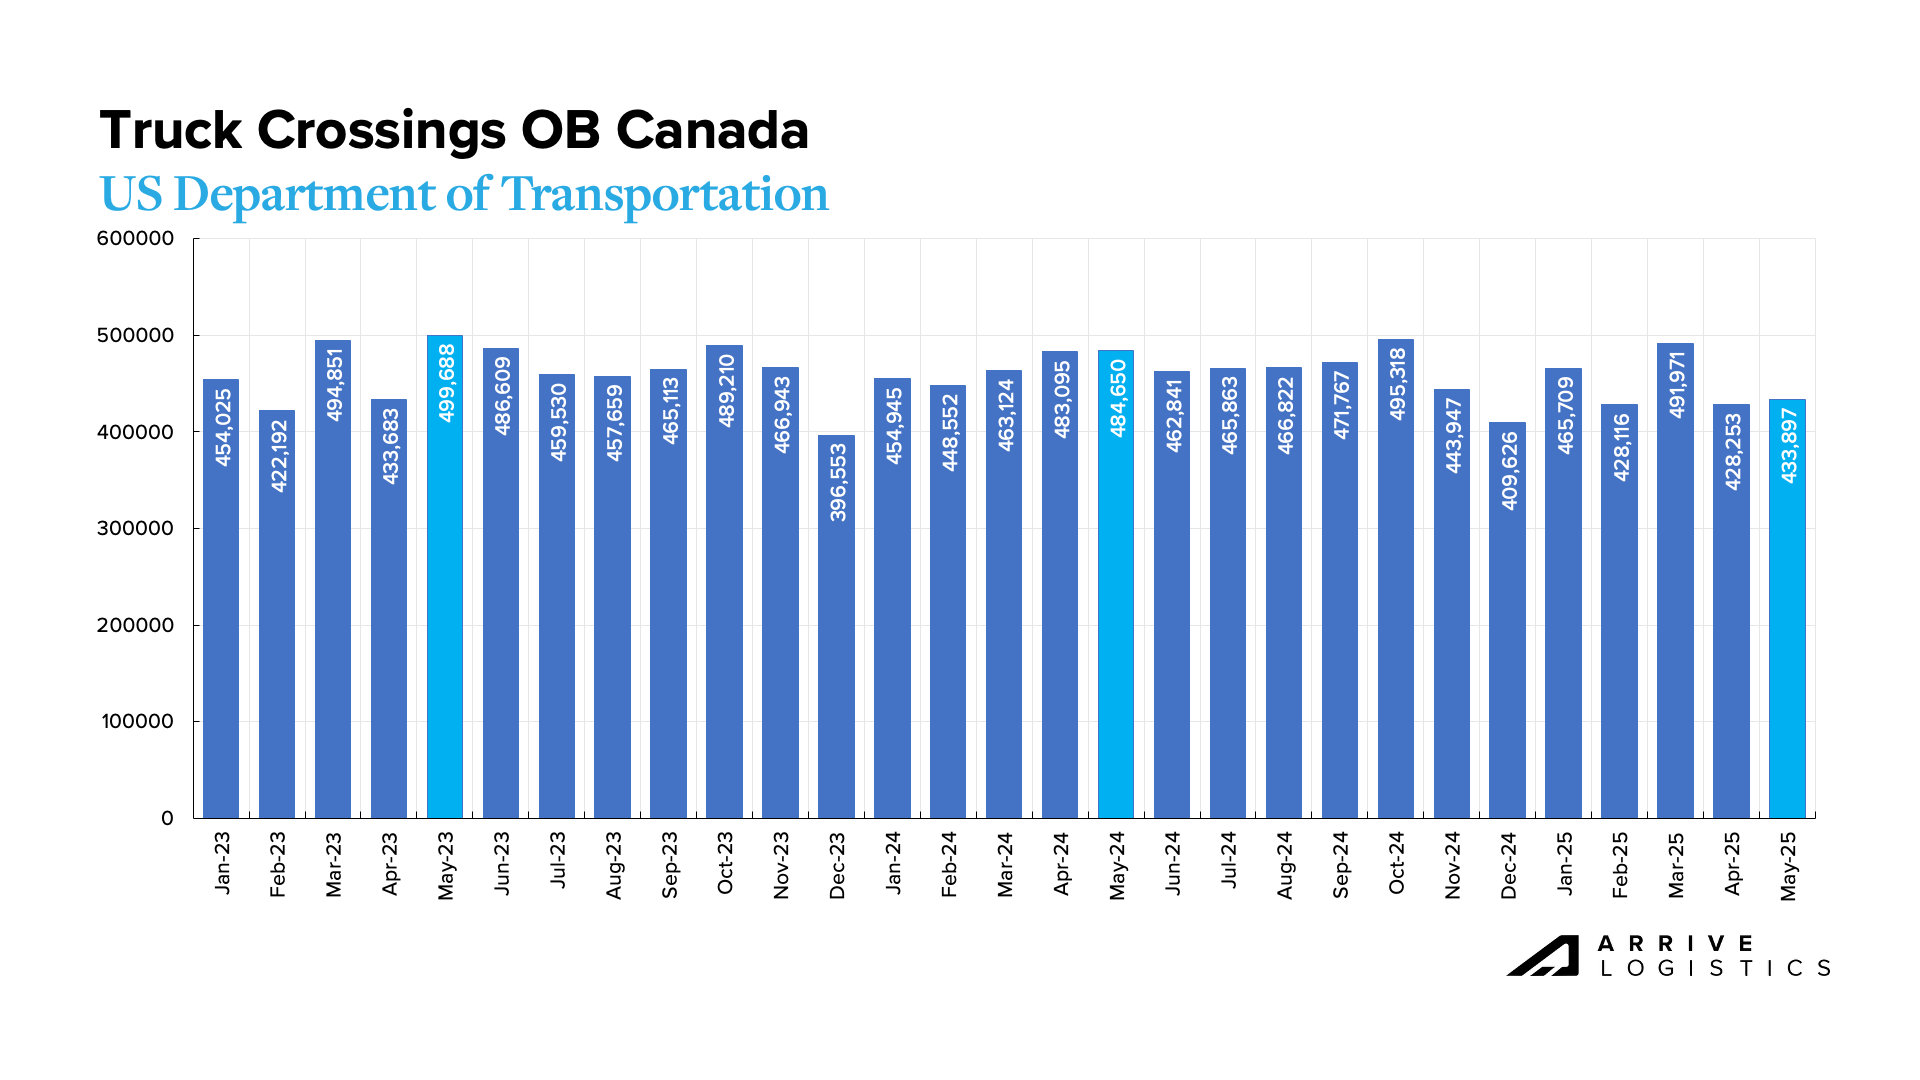
U.S. Department of Transportation data shows year-to-date outbound cross-border truck crossing volumes down 3.7% year-over-year through May, with gains in January and March offset by declines in February, April and May. The April and May drops — both over 10% — signal a clear pullback in demand on cross-border lanes. Some of that softness reflects pull-forward activity earlier in the year, suggesting volumes could gradually rebound as inventories run out. However, further demand degradation due to other economic weaknesses will likely limit the recovery.
Truckload Indicators
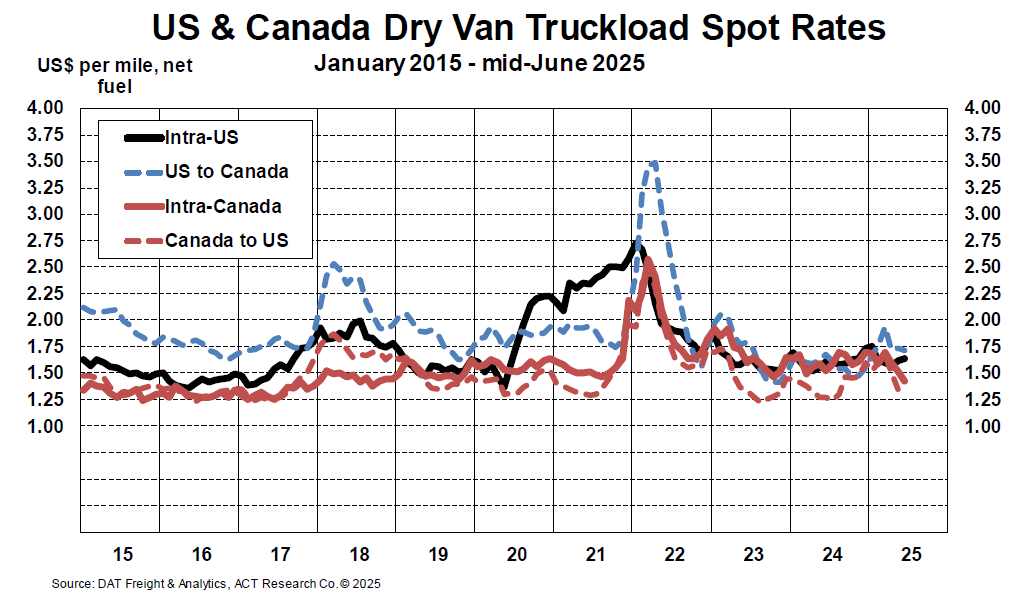
Rate movements remain the strongest indicator of overall supply and demand conditions. Weaker demand in May and June drove rate declines across both cross-border and intra-Canada lanes over the past two months. An ACT Research analysis of DAT data showed intra-Canada rates fell $0.17 per mile during that time. The report also noted that Canada-to-U.S. rates dropped the most, reflecting softening southbound volumes, while U.S.-to-Canada rates have returned to a more typical premium over broader market rates due to reduced southbound freight. Although demand weakness should continue to pressure rates in the near term, ongoing reductions in supply are expected to create more favorable conditions for recovery in 2026.
LoadLink truck posting data offers a glimpse into the amount of capacity searching for freight. Elevated spot load postings kept truck postings low early in the year, but they rose as spot demand eased. While demand has stabilized, overall truck postings remain low compared to prior years, evidence that the broader capacity environment has tightened over the past year.
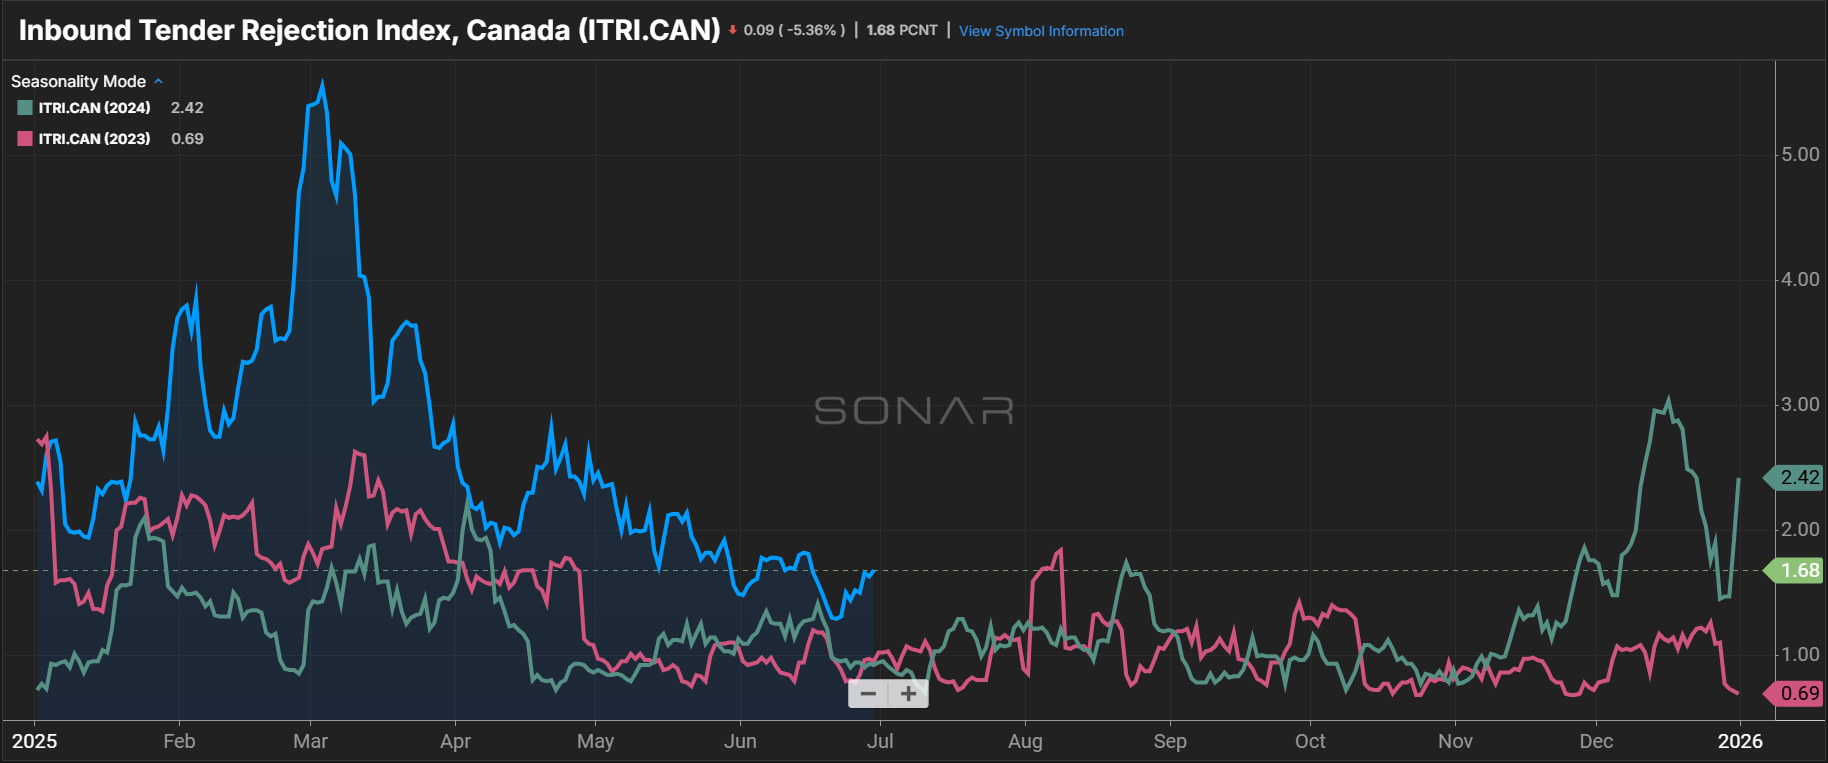
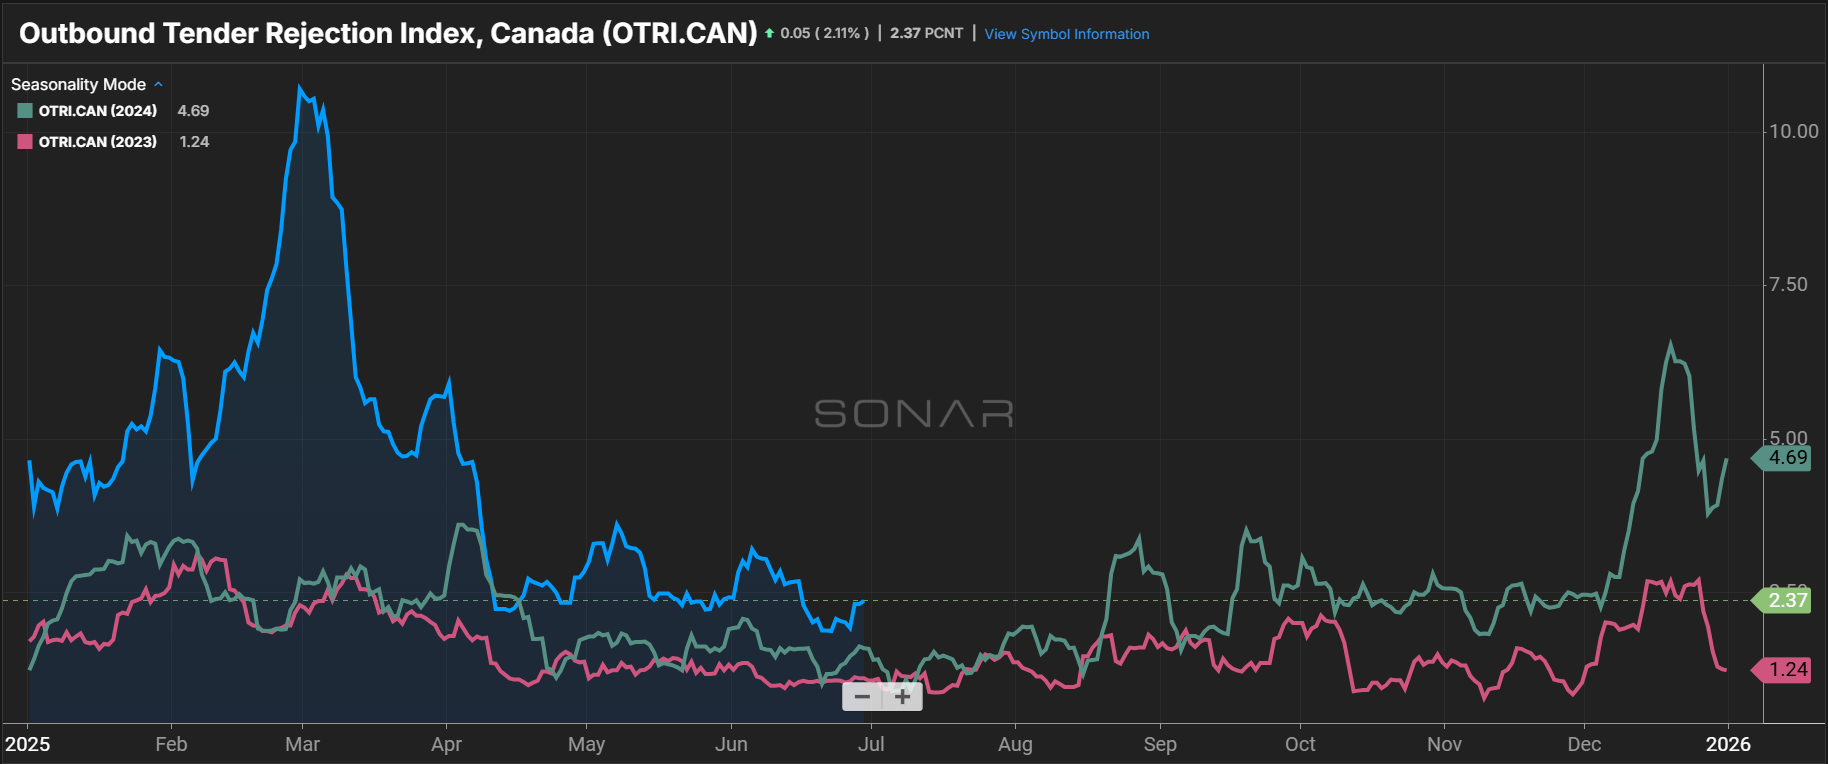
Sonar Tender Rejection data provides insights into primary tender acceptance rates for contract carriers. On lanes both in and out of Canada, early-year tightness has given way to more normalized rejection rates, which appear to be tracking typical seasonal patterns—albeit at slightly elevated levels compared to prior years. The modest uptick in 2025 rejections reflects more balanced supply conditions, but at less than 2.5% for both directions, shippers continue to see exceptionally high acceptance rates on cross-border contract volumes.
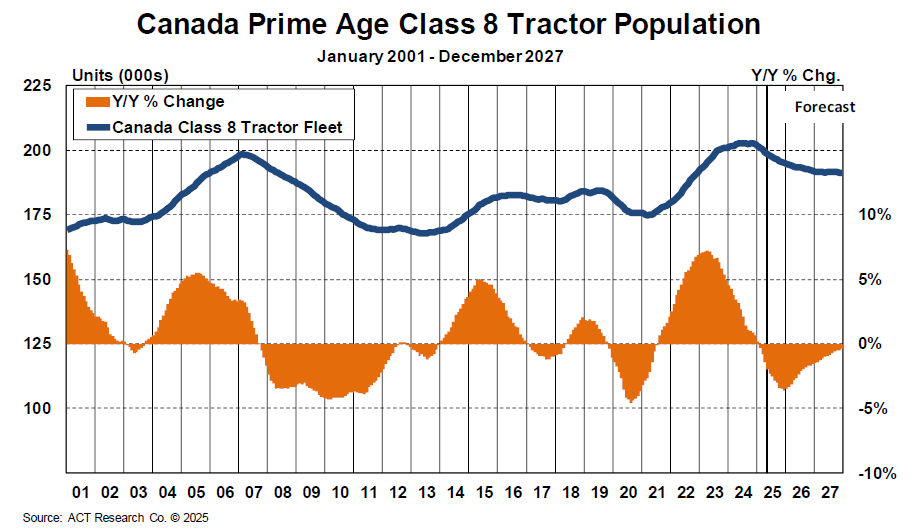
ACT Research reports that the Canadian prime-age Class 8 tractor population is declining after four years of growth. The fleet, currently estimated at 198,000 units, is down 2.3% year-over-year and could contract by 3.6% by the end of 2025. While Class 8 prices in Canada are expected to rise more slowly than in the U.S. due to more favorable trade conditions with Mexico, they are still climbing. A low rate environment paired with more expensive equipment will create a tightening supply landscape. The silver lining for Canadian carriers is that shrinking capacity should support more favorable rate conditions in 2026.
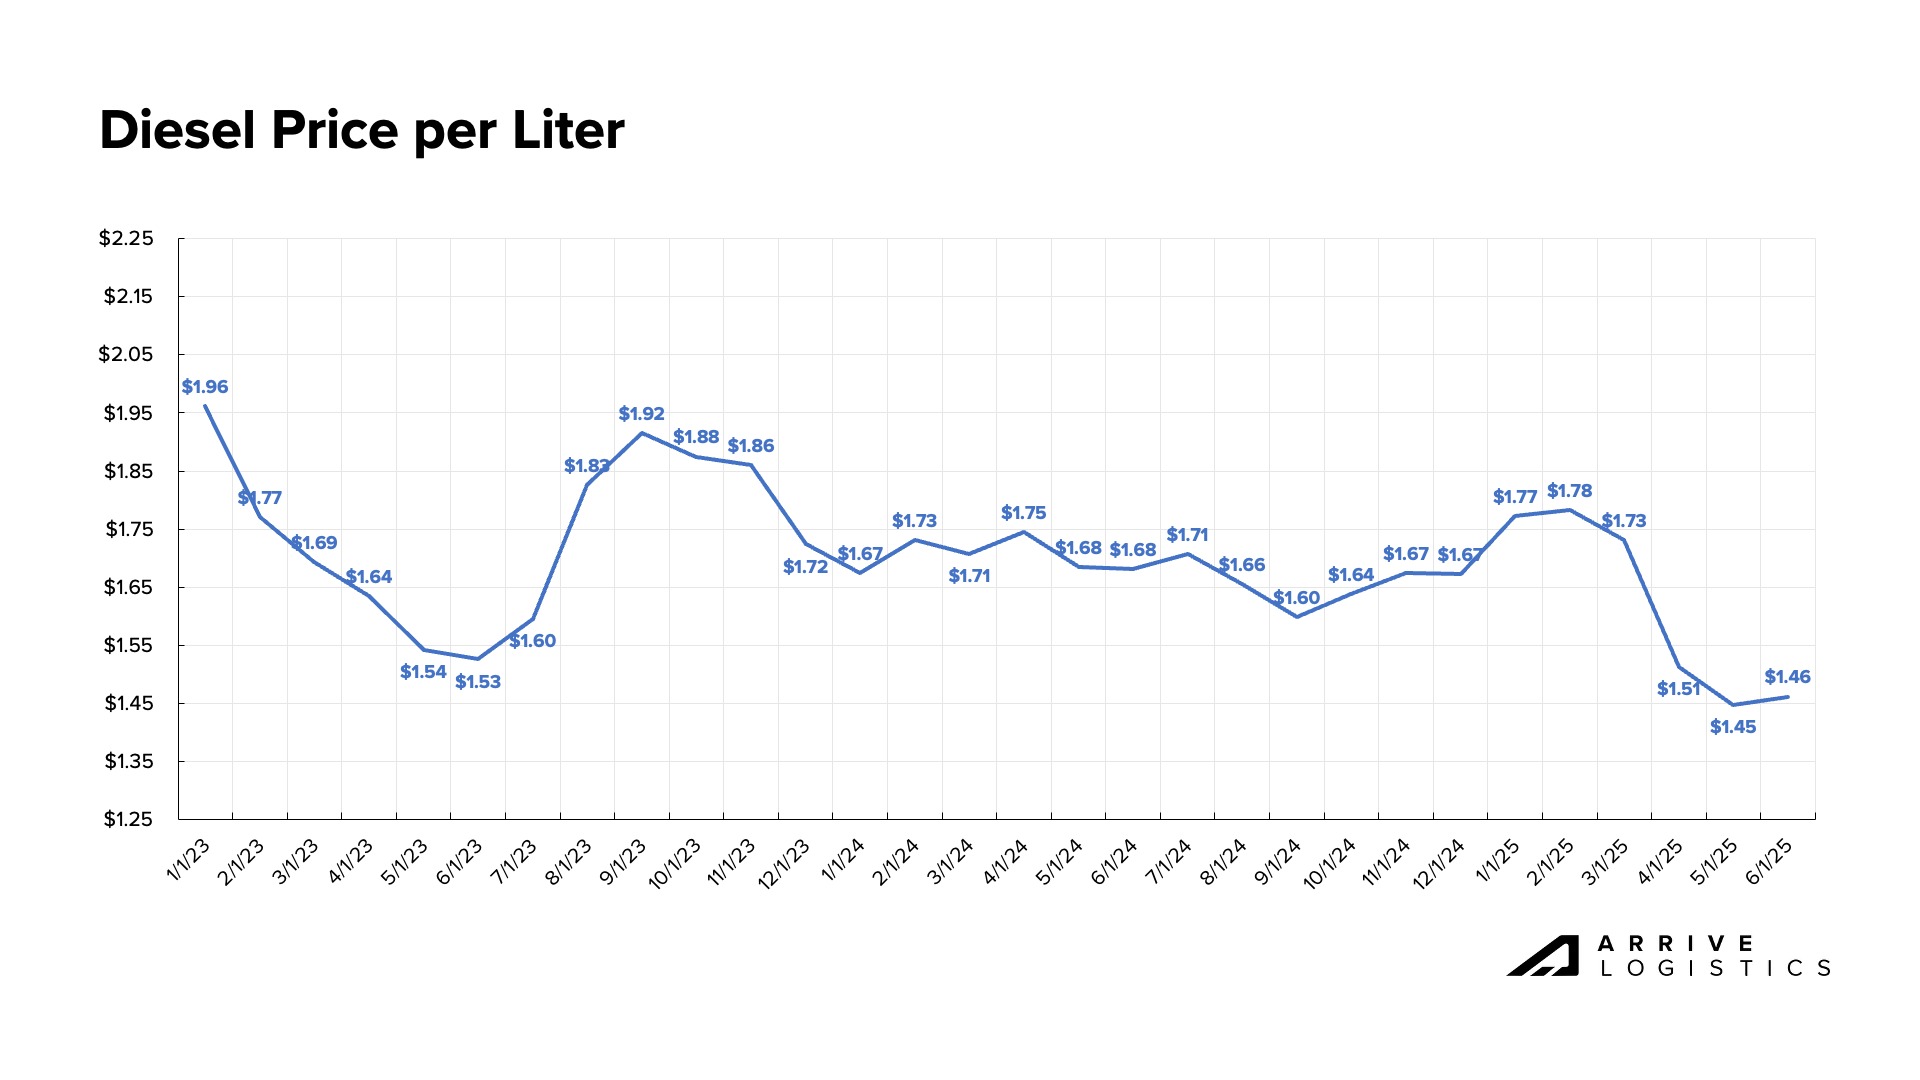
Canadian diesel prices have been volatile through the first half of the year. After reaching a high of C$1.81 in late January, prices fell to a multi-year low of C$1.42 by early June. They climbed back above C$1.50 in late June as the conflict in the Middle East intensified, but there are no signs of a sustained increase in fuel costs at this time.
Economic Indicators
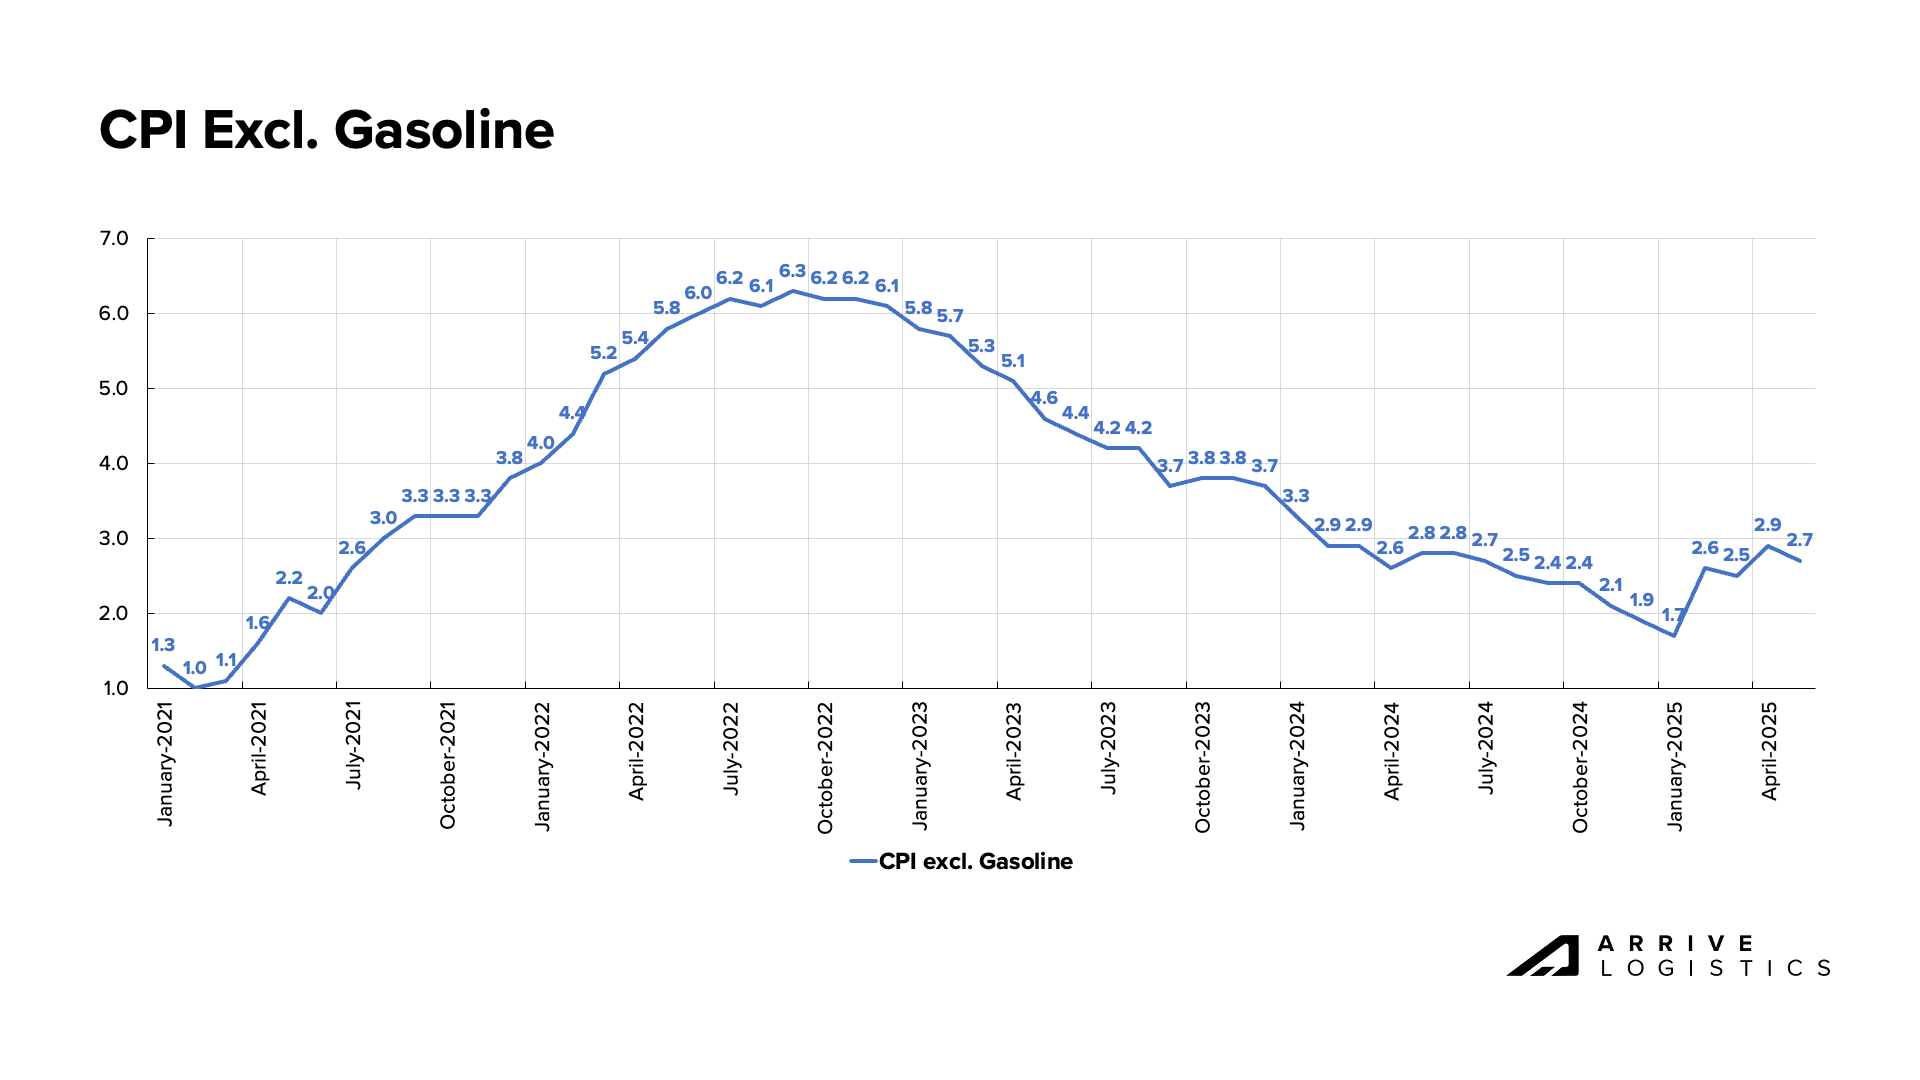
Inflation fell to 1.7% after spiking to 2.6% in February. However, when excluding gasoline, the trend looks different, with core inflation rising to 2.9% in April. Gasoline spending dropped sharply after the Carbon Tax, or “Fuel Tax,” was eliminated on April 1, reducing prices by more than $0.10 per gallon. The Bank of Canada had anticipated a short-lived dip in inflation from the tax removal, followed by a rebound to around 2%. As a result, no movement on interest rates is expected.
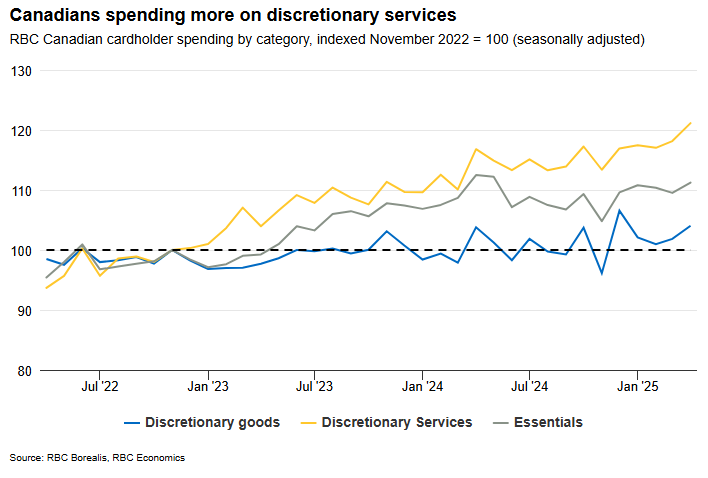
Royal Bank of Canada (RBC) card data showed broad-based consumer spending growth in Q2, with notable increases in discretionary purchases across both goods and services. The uptick in spending signals persistent consumer spending power, a positive for freight demand. However, reduced spending on goods and higher prices could limit freight demand growth.
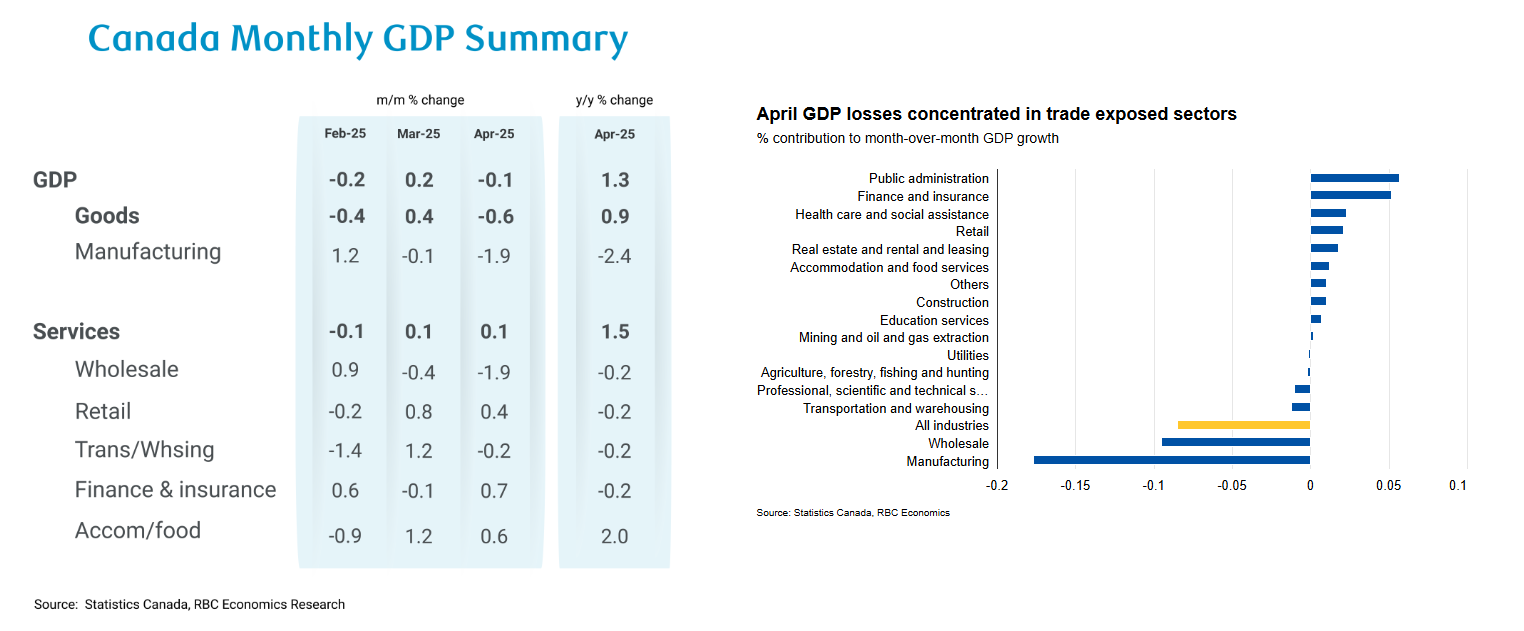
Canada’s real GDP continues to reflect steady economic growth, with Q1 2025 marking the highest reading on record, though signs of a slowdown are emerging. According to its April Monetary Policy Report, the Bank of Canada anticipates stable or potentially contracting GDP ahead. Ongoing tariff uncertainty is putting downward pressure on Canadian economic output and weighing on both intra-Canada and outbound cross-border freight demand. This is especially apparent in the 2.4% decline in manufacturing GDP in April. With the U.S. as the largest importer of Canadian goods, demand could decline further as tariff-related costs are passed on to consumers.
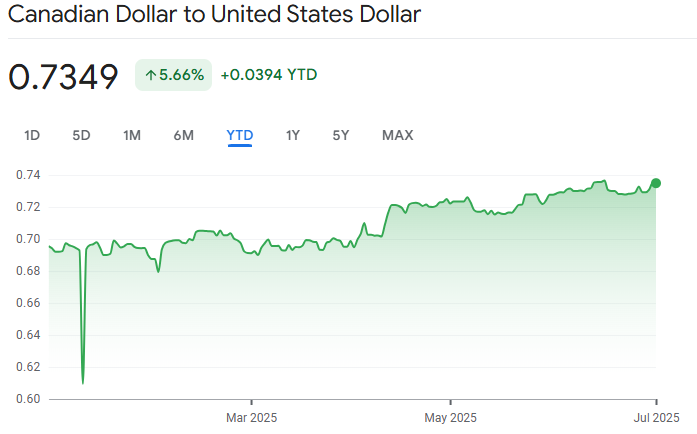
The Canadian dollar (CAD) has appreciated 4.3% against the U.S. dollar since January. Although this increases spending power for Canadians on U.S. goods, this shift has negatively affected Canadian businesses that pay expenses in CAD but earn revenue in USD, devaluing income amid already elevated operating costs. The stronger CAD also slightly reduces U.S. purchasing power for Canadian goods. Combined with rising trade costs from tariffs, these factors are putting additional downward pressure on cross-border freight demand.
About this Report
The Arrive Canada Market Update, created by Arrive Insights, is a report that analyzes data from multiple sources, including but not limited to Statistics Canada, BMO Bank, Loadlink Technologies and American Trucking Associations, from the past month as well as year-over-year. Please note that all dollar amounts are in CAD. We know market data is vital in making real-time business decisions. At Arrive Logistics, we are committed to giving you the data and insights you need to better manage your freight.